Cost of VSAM Hardware Compression
What will be the cost of loading VSAM files when hardware compression is enabled? It seems likely that this will be a linear function of the amount of data being loaded with possible effects from the CI size and the FREESPACE specifications in the VSAM definitions.
To test these hypotheses, a series of test cases were built based upon a dataset of known size and characteristics. A set of input datasets were built containing 10, 20, 30, and 60 megabytes of data respectively and then jobs were executed to do a delete/define followed in a separate step by the LOAD of the VSAM file. Each test was repeated 30 times on each of S90A, S90B, S90C, and S90D.
On each system, tests were run with a CI size of 4K and 0 freespace, 24K CI size and 0 freespace, and 24KCI size with 50/10 freespace specified. In addition, the tests were repeated for standard VSAM, extended format VSAM, and extended format VSAM with hardware compression.
The results of the tests confirm the linear function expected. One surprising aspect is that for compressed datasets, the effect of CI size and free space definitions disappears. This can be seen in figures 1-3 (attached separately.) For these particular tests, the results are almost equal with compression enabled regardless of the CI size and freespace in use.
From these tests (documented in figures 4-6) we can derive equations to estimate the CPU time required to load a VSAM file based on the volume of data to be loaded. Table 1 documents the derived formulas.
|
Processor |
Fixed Cost |
Variable Cost /MBYTE |
Estimated CPU Time to Load 4GB |
Normalized GS2127A CPU Time |
|
GS2127A |
.285 |
.052 |
00:03:28 |
00:01:31 |
|
9672-Z67 |
.117 |
.070 |
00:04:40 |
00:04:40 |
|
700-7Z5 |
.406 |
.153 |
00:10:12 |
00:03:41 |
|
5995M-12670 |
.466 |
.384 |
00:26:13 |
00:07:44 |
|
500-585 |
1.067 |
.259 |
00:17:17 |
00:03:47 |
These numbers assume a 24K CI size with zero free space specified as this was the best case scenario and there seemed little difference when the CI size was changed or the free space was increased and the file was compressed. It is clear from the data that this is NOT the case when normal or extended VSAM datasets are being loaded without compression. In those instances, there can be a significant (statistically) effect.
The volume of data being loaded is small. Do the equations really hold up at 4GB of data? A test was run with 3,944MB of data just to check. The results were:
|
Processor |
Estimated CPU |
Actual CPU |
% Change |
|
GS2127A |
00:03:25 |
00:03:16 |
-4 |
|
9672-Z67 |
00:04:36 |
00:04:27 |
-3 |
Close enough for government work. The equations are a reasonable approximation of what will happen as the data grows.
Compare these with numbers for loading exactly the same data with EXTEND DASD.
|
Processor |
Level |
Fixed Cost |
Variable Cost /MBYTE |
Estimated CPU to Load 4GB |
Normalized 700-7Z5 CPU Time |
|
700-7Z5 |
Medial |
.438 |
.058 |
00:03:58 |
00:03:38 |
|
Full |
.557 |
.179 |
00:12:14 |
00:12:14 |
|
|
5995M-12670 |
Medial |
.430 |
.067 |
00:04:37 |
00:03:59 |
|
Full |
.600 |
.229 |
00:15:39 |
00:13:30 |
|
|
500-585 |
Medial |
1.189 |
.095 |
00:06:30 |
00:04:09 |
|
Full |
1.576 |
.288 |
00:19:40 |
00:12:36 |
On the systems with CMOS processors, hardware compression outperforms EXTEND DASD but on the older ECL system (5995) EXTEND DASD outperforms hardware compression significantly. The CPU cost of EXTEND DASD is independent of the hardware architecture since the compression is being done in software as opposed to mushyware.
What about the time to UNLOAD the data? Is there a difference in the CPU required to decompress the data? The inverse of the same tests was run under the same set of conditions.
|
Processor |
Fixed Cost |
Variable Cost /MBYTE |
Estimated CPU Time to Unload 4GB |
Normalized 9672-Z67 CPU Time |
|
GS2127A |
.290 |
.034 |
00:02:16 |
00:00:59 |
|
9672-Z67 |
.117 |
.024 |
00:01:36 |
00:01:36 |
|
700-7Z5 |
.352 |
.046 |
00:03:04 |
00:01:06 |
|
5995M-12670 |
.392 |
.054 |
00:03:42 |
00:01:05 |
|
500-585 |
.986 |
.077 |
00:05:16 |
00:01:09 |
There is obviously a lot less CPU time required to decompress the data than to compress the data. SO how does this compare to EXTEND DASD for the same operation?
|
System |
Level |
Fixed Cost |
Variable Cost /MBYTE |
Estimated CPU to Load 4GB |
Normalized 700-7Z5 CPU Time |
|
700-7Z5 |
Medial |
.404 |
.056 |
00:03:49 |
00:03:49 |
|
Full |
.486 |
.118 |
00:08:03 |
00:08:04 |
|
|
5995M-12670 |
Medial |
.423 |
.065 |
00:04:26 |
00:03:49 |
|
Full |
.534 |
.145 |
00:09:54 |
00:08:36 |
|
|
500-585 |
Medial |
1.284 |
.097 |
00:06:38 |
00:04:15 |
|
Full |
1.450 |
.199 |
00:15:17 |
00:08:23 |
For medial compression, EXTEND DASD and hardware compression are essentially the same. However, for full compression, hardware compression outperforms EXTEND DASD significantly in every case.
While the changes in CPU consumption may be significant in relationship to one another, in absolute terms they are almost inconsequential. We are generally talking about very small fractions of seconds/MBYTE of data . These tests seem to indicate that at small CI sizes, extended format VSAM may be slightly more efficient than standard VSAM but the difference is not enough to warrant the risks associated with converting massive numbers of files.
As expected, the increases in CPU consumption are greater on the older technology 5995 than on the newer CMOS systems. On the CMOS systems, the increases are proportional to the relative speed of the systems.
These tests seem to suggest that for the most part, some efficiency will be gained for files that are currently fully compressed with EXTEND DASD.
For files that are medially compressed, there may be an increase in CPU times to LOAD the files but the time to read the data will be greatly reduced. These files may actually require more attention than the files that are fully compressed because the differential in times is greater.
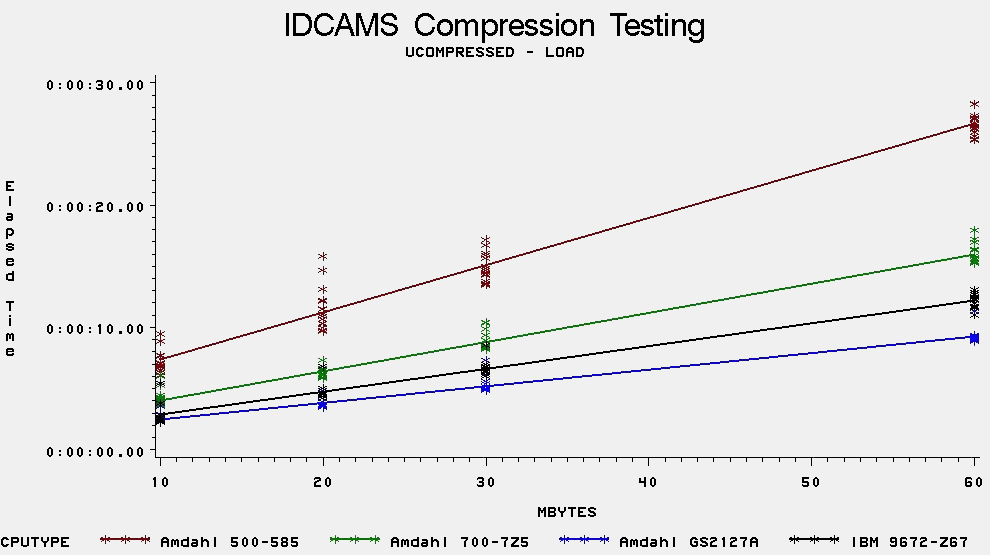
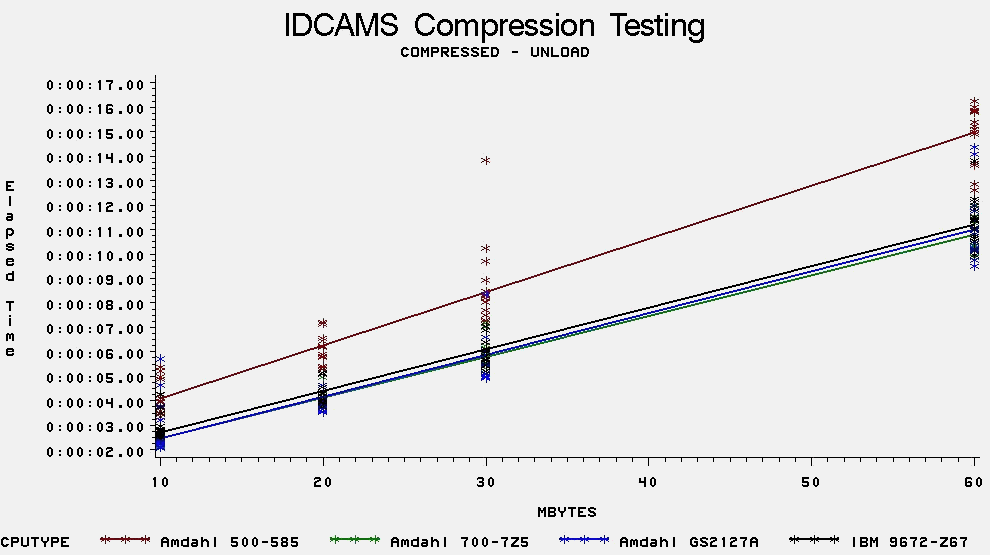
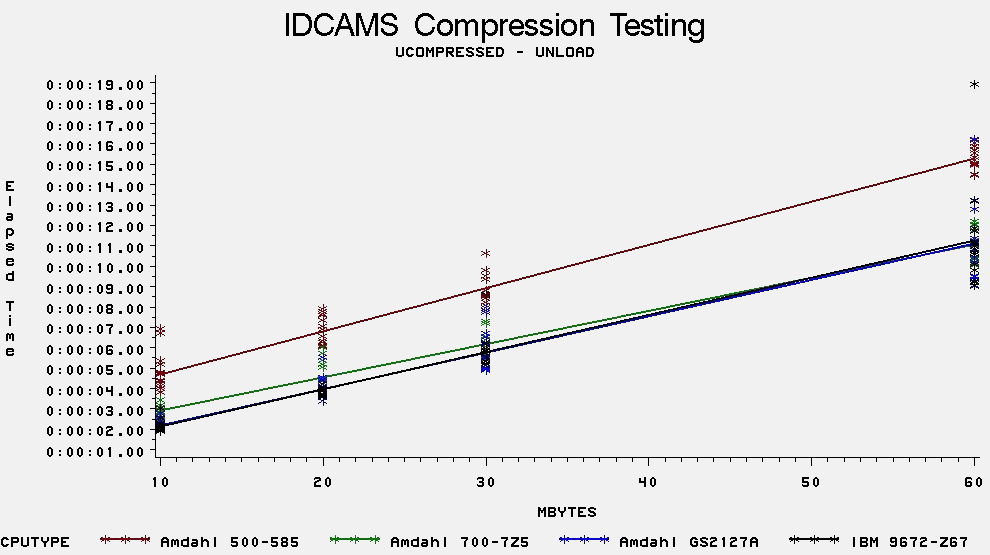
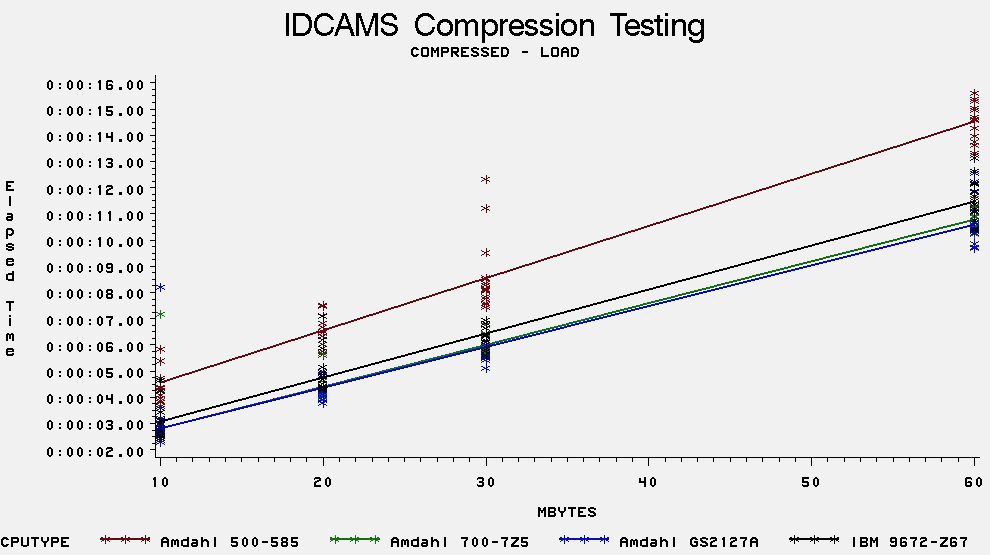
An interesting side trip through this data is to look at the elapsed times. One would expect that the elapsed time would be a function of the relative speeds of the processors involved since the amount of data being transferred is constant and (one would expect) the data transfer time would be the same. That is not in fact what happened.
This data suggests that under heavy IO loads, the Amdahl GS2127A will consistently outperform the IBM 9672-Z67. Subsequent tests have confirmed this hypothesis and in fact, we are seeing this phenomenon in production jobs. In some cases, the 700-7Z5 will also outperform the 9672.
No explanation is offered but the observation is that work that performs large amounts of IO may perform better (though it may use more CPU) on either of the large Amdahl processors than on the IBM processor. If CPU time is the dominant component of run time, then the IBM processor will be faster but as IO increases, the performance characteristics degrade.